Registrations Dashboard
The Registrations Dashboard provides a detailed breakdown of key data sets about the registrations for your event.
Viewers can analyse detailed aspects of the ticket registration. This data is especially useful as it could offer insight into which Tickets and Add-ons are most popular or successfully promoted by advertising campaigns
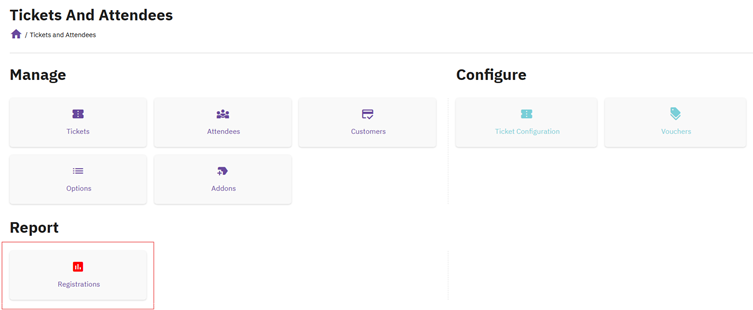
Go to: Tickets and Attendees -> Registrations (in the “Report” section)
.
The data shown on this dashboard provides answers to the following questions:
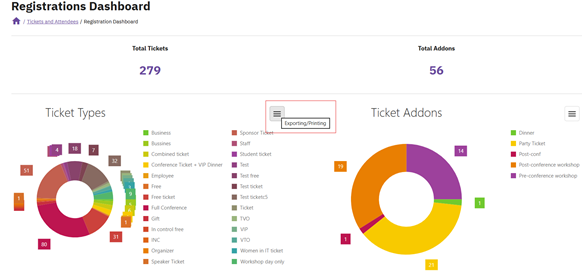
- What are your total registration numbers?
- How do ticket registrations break down by Ticket types and Ticket Add-Ons?
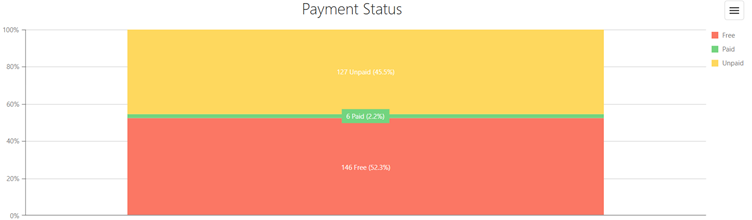
- What is the payment status of issued tickets?
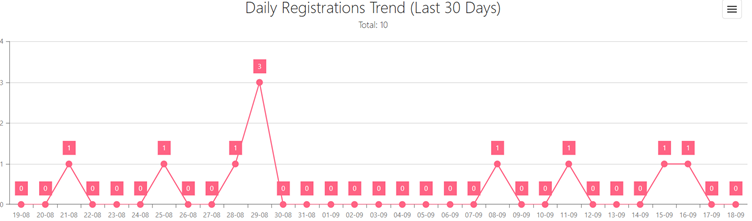
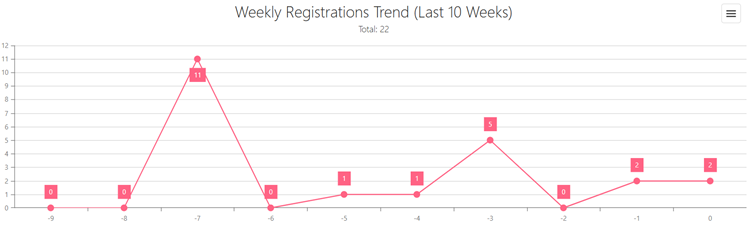
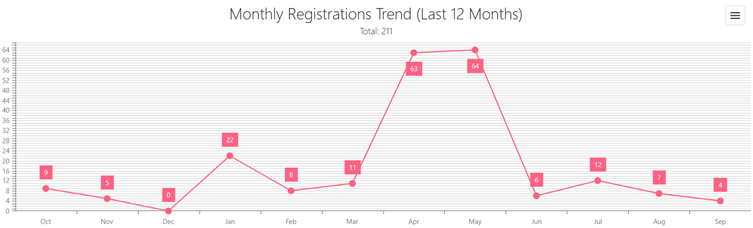
- What are the trends of registrations by date, weeks and months?
Doughnut chart for tickets and add-ons highlights which items are selling the most. This allows decision-makers to evaluate current registration numbers, and whether additional sales & marketing strategies might be beneficial for tickets with lower registration numbers.
Each chart can be easily exported in various formats, such as JPG, PNG, PDF, and more.
With the dashboard’s line graph, you can see the number of registrations for each Ticket and Add-ons each day. Line graphs are particularly useful for tracking trends that may occur over time as leaders can track data across days, weeks, months, or years.