Tickets And Attendees — Reports
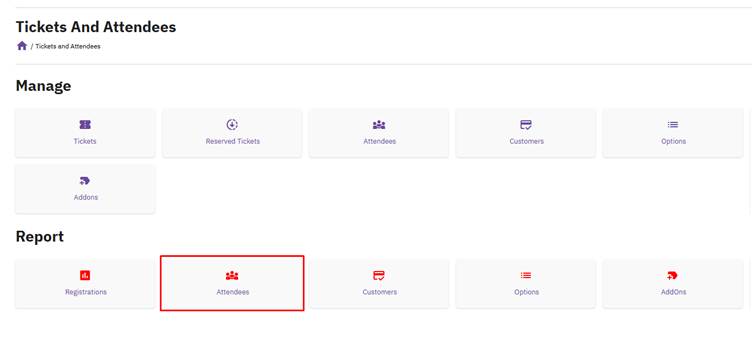
Attendees
Go to: Tickets And Attendees → Reports → Attendees
The Attendees report dashboard provides detailed information about your attendees, including their ticket type and country of residence. Beyond these two core data points, this report also surfaces all custom fields created within your ticket types.
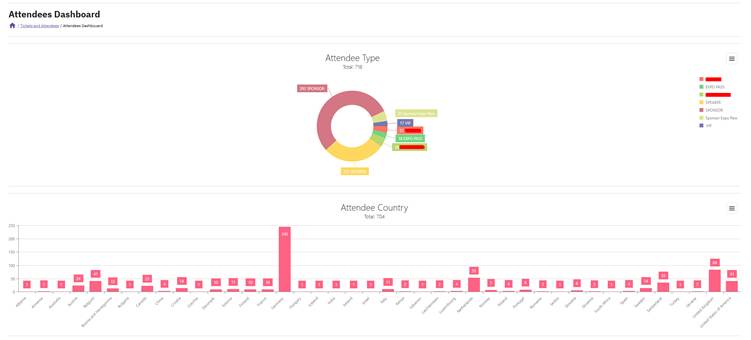
Custom field charts can be especially useful for gathering key logistical information in one place — for example, T-shirt sizes, dietary requirements, or any other data you've collected during registration. If you're planning to distribute merchandise, you can use this report to see exactly how many of each size you'll need to order.
Note: All charts are available for export in PNG, JPEG, PDF, and SVG formats.
Customers
Go to: Tickets And Attendees → Reports -> Customers
The Customers report dashboard helps you visualize information about the types of payments made for your event. This includes whether payments were made by a company or an individual.
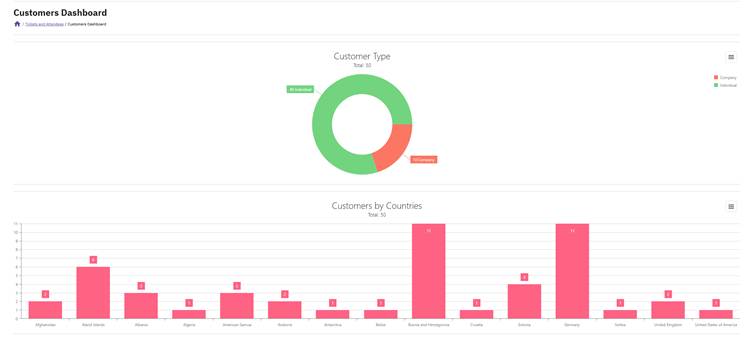
Additional charts within this dashboard highlight your top customers, giving you a quick view of who your most active buyers are.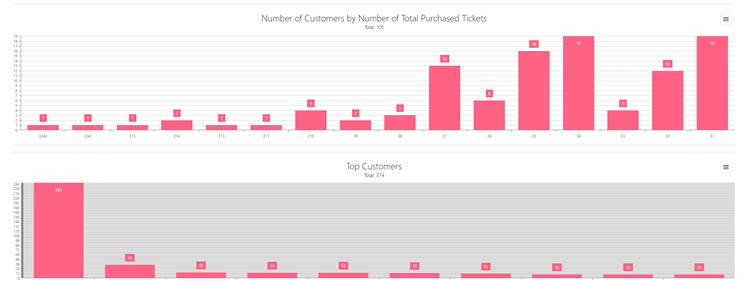
Options
Go to: Tickets And Attendees → Reports -> Options
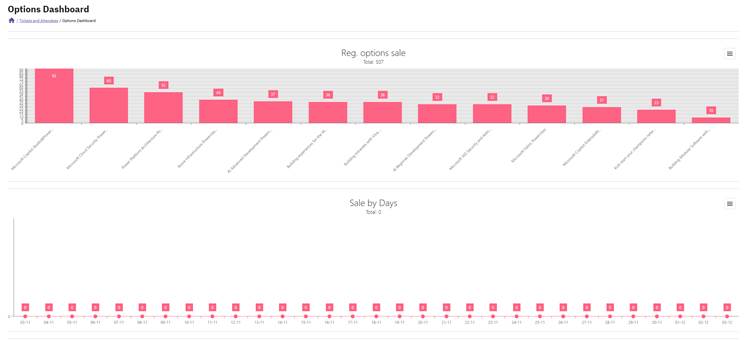
The Options report dashboard provides detailed information about all ticket options selected within a specific period — broken down by days, weeks, and months. The first chart shown is particularly valuable, as it reveals which options are most popular and interesting to your customers, helping you make informed decisions about future event offerings.
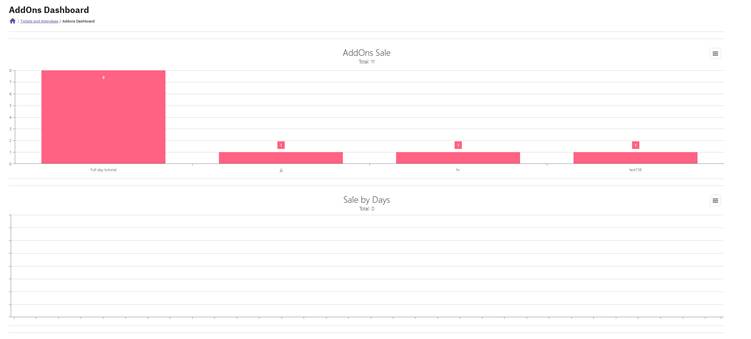
Addons
Go to: Tickets And Attendees → Reports -> Addons
The Addons report dashboard provides insight into all ticket add-ons purchased alongside tickets, along with the periods in which they were purchased — broken down by days, weeks, and months. The first chart focuses on the number of add-ons sold, making it easy to identify which add-ons are most popular among your attendees.