Content and Speakers — Reports
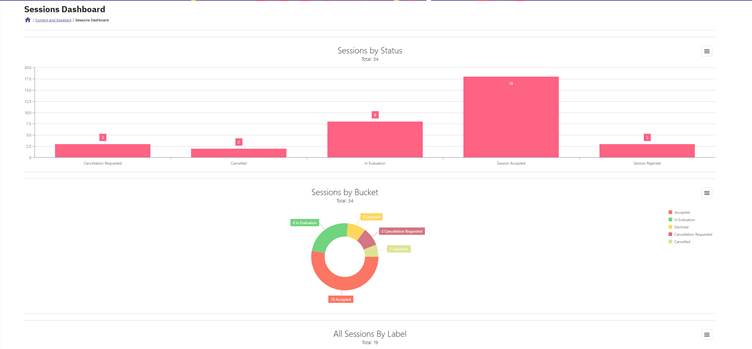
Sessions
Go to: Content And Speakers → Reports → Sessions
The Sessions report gives event organizers a comprehensive summary of session counts organized by various categories, including:
- System Status — the current status of each session
- Buckets — groupings assigned to sessions
- Labels — tags applied to sessions
- Submissions over time — showing how many sessions were submitted over the course of several weeks
Note: All charts are available for export in PNG, JPEG, PDF, and SVG formats.
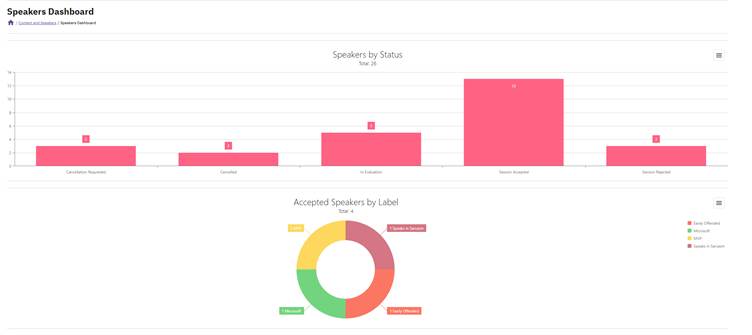
Speakers
Go to: Content And Speakers → Reports → Speakers
The Speakers report dashboard contains multiple graphs that present your speakers segmented by status, label, and country of residence.
A few things to keep in mind when reading this report:
- The status graph shows how many speakers are currently in each status stage.
- The label graph counts speakers per label. Since a single speaker can hold multiple labels (e.g., "Microsoft" and "AI"), each label that speaker holds adds +1 to the corresponding pie chart value. This means totals across labels can exceed your total speaker count.
- The country graph shows the geographic distribution of your speakers based on their country of residence.
Attendance
Go to: Content And Speakers → Reports → Attendance
The Attendance dashboard displays visual reports that break down session participation, including:
- Total attendance per label
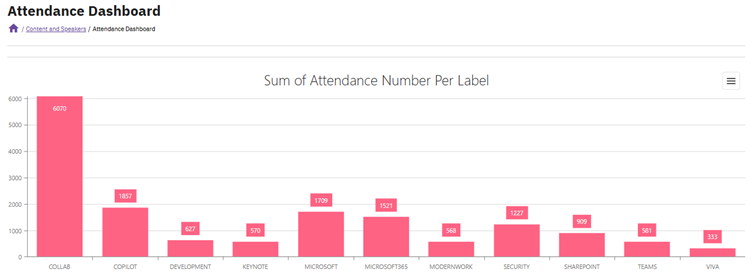
- Average attendance per label
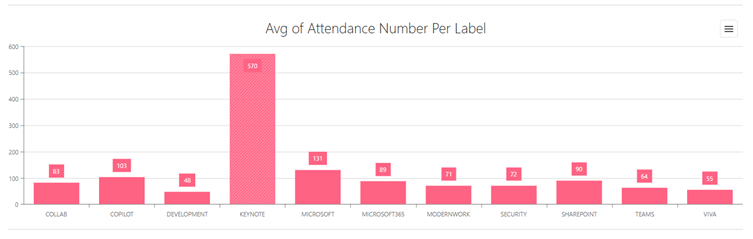
- Attendance numbers per individual session
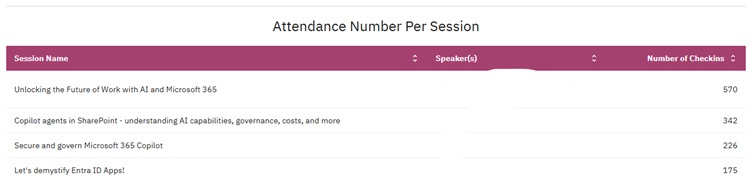
These graphs help you quickly understand engagement trends across your event’s sessions.
Feedback
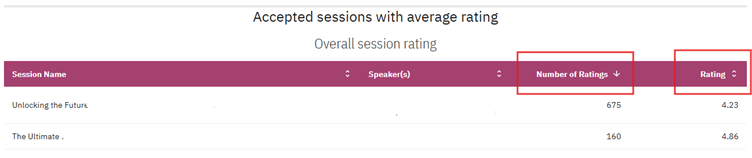
Rating Dashboard
The Rating Dashboard provides an overview of session feedback collected from attendees.
It includes:
- Average Rating by Session Label
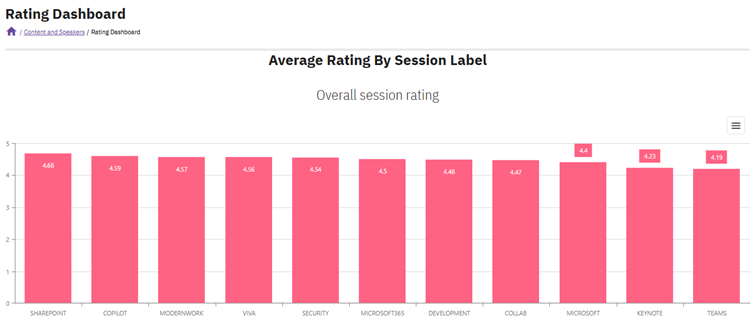
- Accepted Sessions with Their Average Rating
For each session, you can see the number of submitted ratings and the overall rating score
This dashboard helps you quickly assess session quality and identify trends in attendee satisfaction.